Is the money your company spending on product information management paying off? How do you know where you should invest? If you are not sure, you are not alone.
Many companies lack the hard data they need in order to measure the impact of change.
But this doesn’t have to be the case. By collecting data prior to, during, and after changes, it is possible to monitor how well progress is being made toward the original objectives that were established, and whether the investment is achieving the desired ROI.
In this article we address ways of measuring changes in how product data is managed to determine whether the changes are helping achieve business objectives and ultimately, if they are improving ecommerce performance.
How Data-Driven Decision Frameworks Help
The basic steps required to measure the impact of changes in the design of product data are straightforward.
Steps in Measuring Effectiveness of Changes in Product Data
.png?width=1171&name=download%20(3).png)
As an example, a company might hypothesize that more complete product attributes will lead to increased conversions, which in turn will lead to increased revenue for those products. Many user-behavior and interaction metrics can be captured and analyzed to provide insights for change. Each of these can be benchmarked and monitored for an acceptable range; e.g., x% of products should have complete attributes, and click-through from landing page to product detail page is expected to be y%).
When measurements are outside of expected ranges, a remediation is implemented, and the process is repeated.
For example, if a large number of newly launched products do not have attributes and click-throughs are below the expected range, backfilling attributes will likely remediate the metric, which will show up through other dashboard indicators.
Measuring and testing enables your organization monitor change.
Using Metrics and KPIs for Organization Governance
A set of key performance indicators (KPIs) offers measurable values that show how efficiently an organization attains key business objectives. Organizations use KPIs at different levels to assess their success at reaching their targets.
- High-level KPIs used by top management or CEOs focus on the overall revenue and all-round performance of the business.
- While mid- and low-level KPIs used by involved digital teams focus on business processes and data that further supports these processes across different departments using scoreboards.
However, there should be a strong linkage between the different levels of processes.
Linkages from the Data Level to Enterprise Strategy
Scorecards enable strategic management performance metrics that support improvement in internal business functions and resulting outcomes. The data, process, and outcome scorecards are utilized to measure and offer feedback to stakeholders with respect to data quality, process indicators, and business results.
.png?width=1244&name=download%20(4).png)
The figure above shows how data can be linked to business processes, which in turn can be linked to business unit objectives and ultimately to enterprise strategy. Content, product data, processes, and outcomes are owned by different departments and organizations, and frequently use different tools and mechanisms. Rarely are consistent decision-making rules, processes and decision-making authority in place. Correlation is difficult to understand or model due to the large amount of data thrown off from multiple customer touchpoints and back.

Sources of Product Data Metrics
Sources of product data metrics include data, testing or simulation on a mock-up website, and actual user testing.
- The first is about structure, balance, quality, and completeness – in other words, they are inherent in the data itself. This can be a good starting point for establishing a baseline and can be compared internally across divisions or externally as compared with competitors.
- The second source is based on interactions, but through testing and simulation.
- The third includes real user behaviors. Each type of measure has value, and correlates to larger business outcomes.
In this example, research has established a correlation attribute fill and click-through rate and product conversations. Similarly, there is a relationship between search recall and conversion rates.
Metrics from Data Quality, Simulation Testing, and User Interactions
.png?width=1063&height=476&name=download%20(5).png)
Tips, Tricks, and Tools to Support Product Data Metrics
Here are guidelines on how to use hard data about product data in order to lead to improved customer experiences and boost ROI:
- Start simple and use what you know
- Consider market references
- Consider home-grown solutions and move to specialized software
- Integrate with existing or emerging data governance programs
- Use revenue in addition to item counts in your metrics
- Tie metrics to conversion rates
- Analyze correlations between types of metrics (design, testing, web analytics)
Benefits of Improving Product Data
Developing a strategic governance plan to remediate gaps and weaknesses with constant product data improvements drives performance levels.
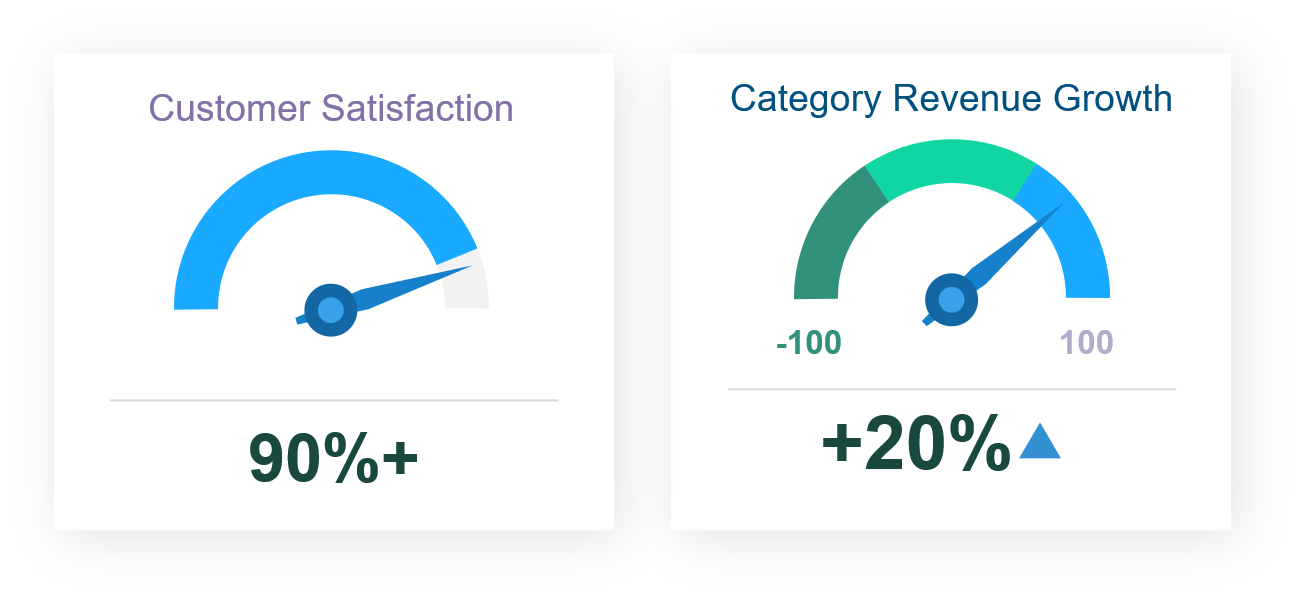
With continuous enhancements, time to market is reduced, bounce rate is cut down, and there is a boost in search click-through rates (CTRs). The improved performance further drives customer satisfaction and increases category revenue growth.
Building Trust In Your Data
There is one more element that is difficult to measure but is very important in any corporate project, and that is trust.
This includes trust in the data and in the process, and belief in the outcome or prediction.
Building personal trust is critical to a project’s adoption and success. It allows people to truly communicate what they don’t agree with, to openly discuss issues, and to be part of the process. The right cadence of communication and level of detail is a fine balance that depends on the executive’s level of knowledge, and how familiar they are with the process. So as you build the metrics and collect hard data, be sure you also tune in to the stakeholders to ensure they are on board.
Ready to start collecting some hard data but aren't sure where to start? We're here to help. Give us a shout!